I’m now living the high life over at https://kde.haraldsitter.eu/
Debugging App Crashes on Windows
The other week the question came up how one can debug an application crash when the Windows Store crash tracking system is unable to produce a usable stack trace. Seemed a good enough opportunity to share some wisdom 🙂
Generally speaking in order to get a stack trace you first need a minidump. minidumps are kind of like core dumps on POSIX systems, well, except, mini. Acquiring that is should be your first goal.
There are a million ways to get a dump, I’ll highlight two of the easiest that I know of.
Partner Center Dumps
Ideally the Microsoft Partner Center will have a dump for you. You can find it usually where the stack trace is as well. To get access to KDE’s applications you need to be a KDE developer and file a sysadmin request. Once you have access you have to head from the Dashboard to Insights then navigate in the left hand pane to Health there use the drop-down to select the application you want to look at. This should give you every bit of information about the application health your heart could desire. You’ll probably also want to switch from viewing the last 72 hours to the last month, unless the application is particularly faulty of course.
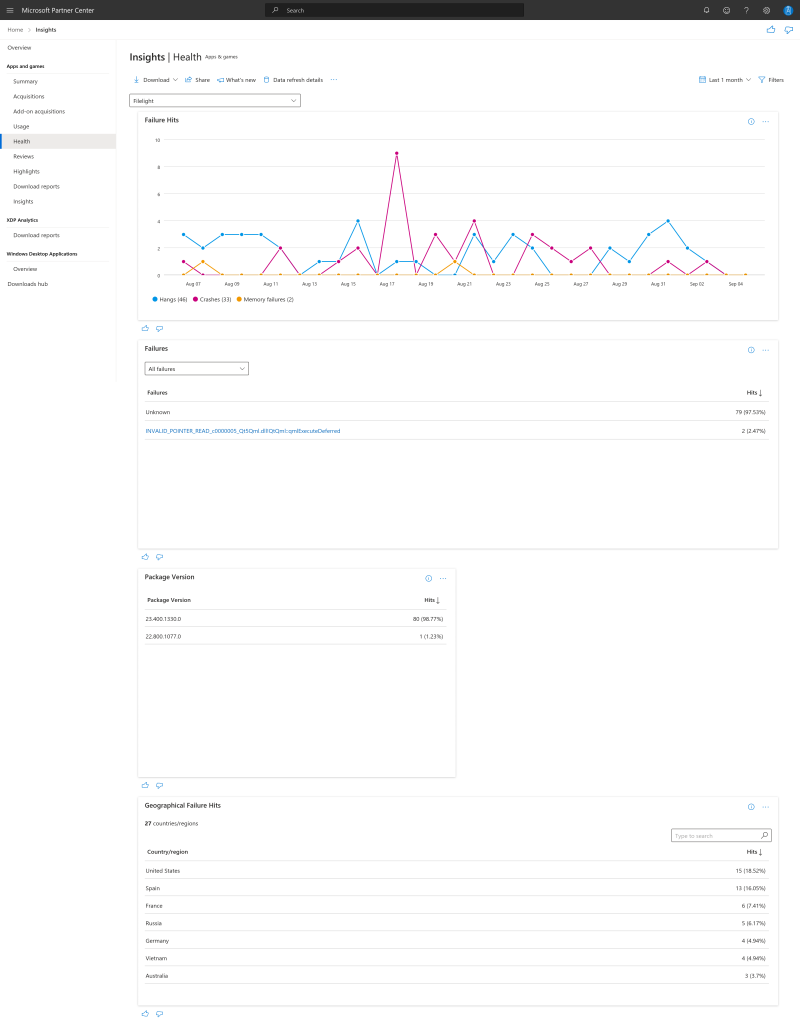
Now all you need to do is click on the crash you want to look at, and not get too annoyed over the unknown crashes you can’t do anything about 😡.
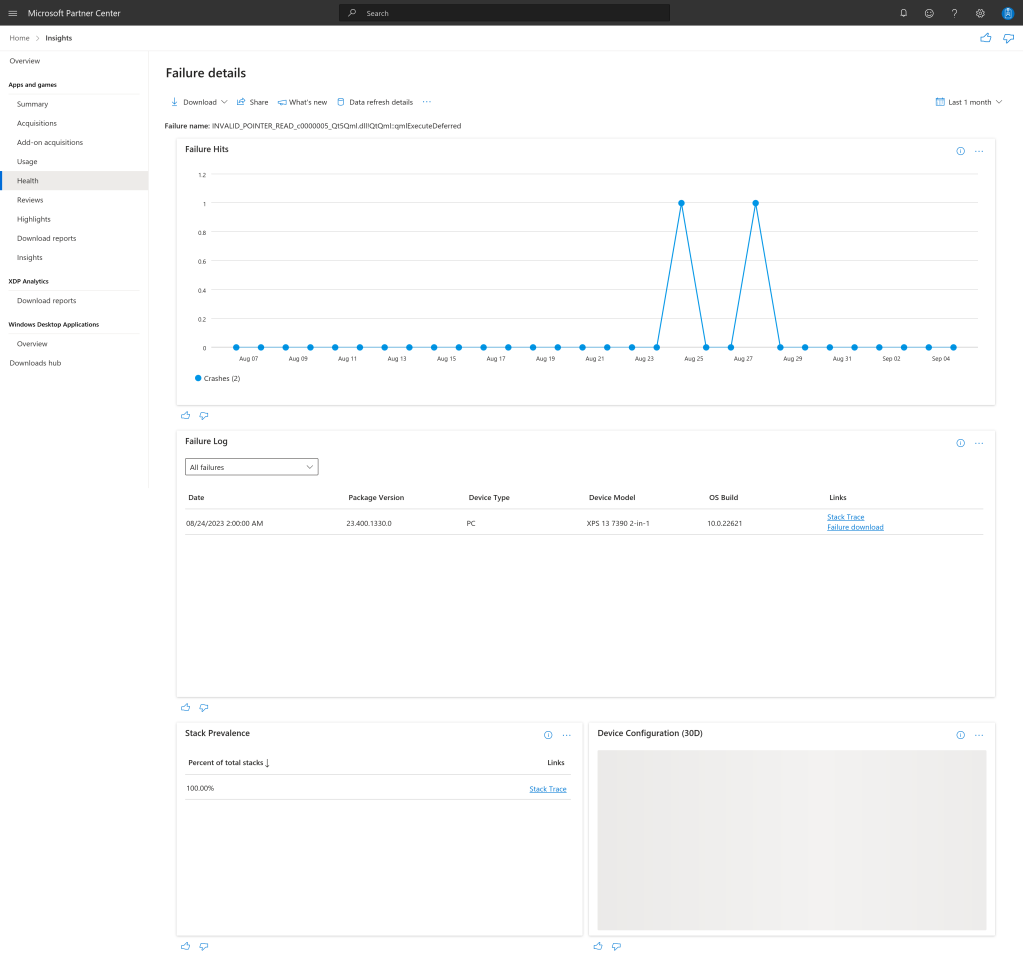
At this point you should be able to find a stack trace link and an additional download link. Sometimes the download link is not there, I have no idea why but I’m sure it’s documented somewhere. The download link is what we are after, it contains the minidump along with some other metadata.
User-Mode Dumps
Now, sometimes the partner center is not able to help us for whatever reason. Maybe the download link is missing, maybe it just doesn’t show the crash we are after, maybe the dump on the partner center is useless. Who knows. In that case we need some help from the user. Thankfully it’s not too painful. They need to enable collection of user-mode dumps by creating the registry key HKEY_LOCAL_MACHINE\SOFTWARE\Microsoft\Windows\Windows Error Reporting\LocalDumps, which then causes the Windows Error Reporting to throw a minidump into %LOCALAPPDATA%\CrashDumps. The user then needs to reproduce the crash and obtain the dmp file from the aforementioned location.
Debug Symbols
Once you have obtained a minidump it’s time to find us some debug symbols. The sad truth here is that I can’t really help with that. Depending on how your application was built you’ll be able to get PDBs somehow hopefully. They will either float around as PDBs somewhere or at the very least will be available inside the .appxupload or .appxsym zip files. As a general best practice for KDE software I would advise that when you do a binary release to the Windows Store you also release the x86_64-dbg.7z file to download.kde.org so we can get the relevant PDBs when needed.
Tracing
Alright, I hope you had luck with finding your debug symbols, because now it’s time to do some tracing! Whee. You’ll need Microsoft Visual Studio. Any edition will do. File->Open->File... the minidump and you should be greeted by a nice overview of metadata about the crash.
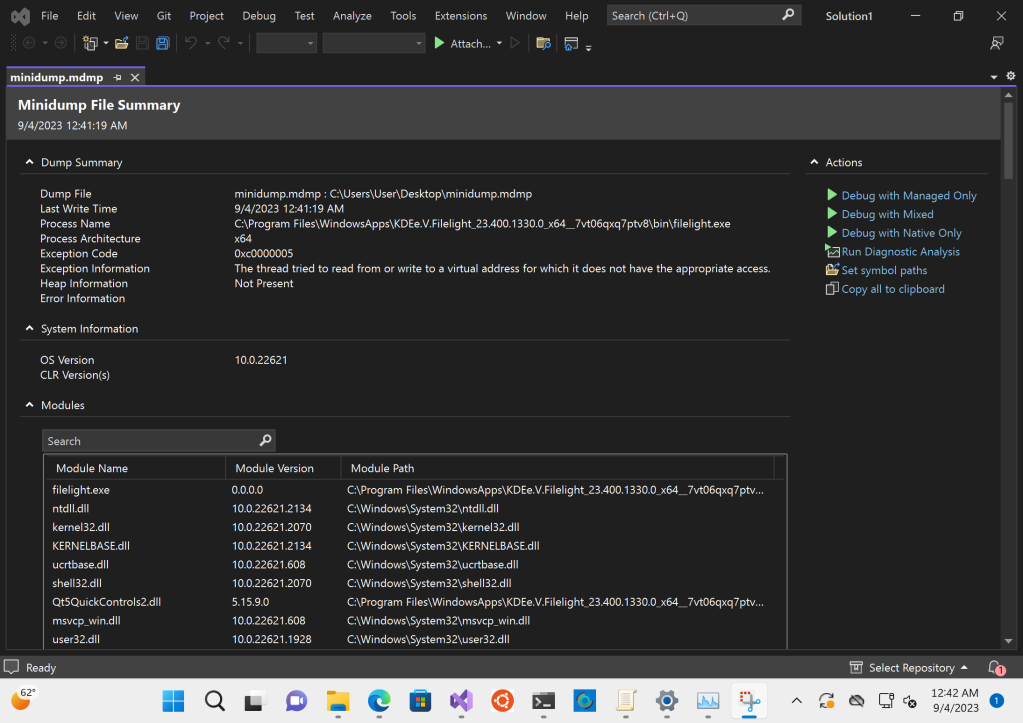
First we’ll want to setup our debug symbols. For that you first want to place your PDBs somewhere in convenient in your file system. I’m lazy and usually just slap them on the Desktop. In Visual Studio you should find the option Set symbol paths in the right hand list of actions. The option opens the settings window on the correct page. Simply hit the ➕ and type out the path where you extracted the PDBs.
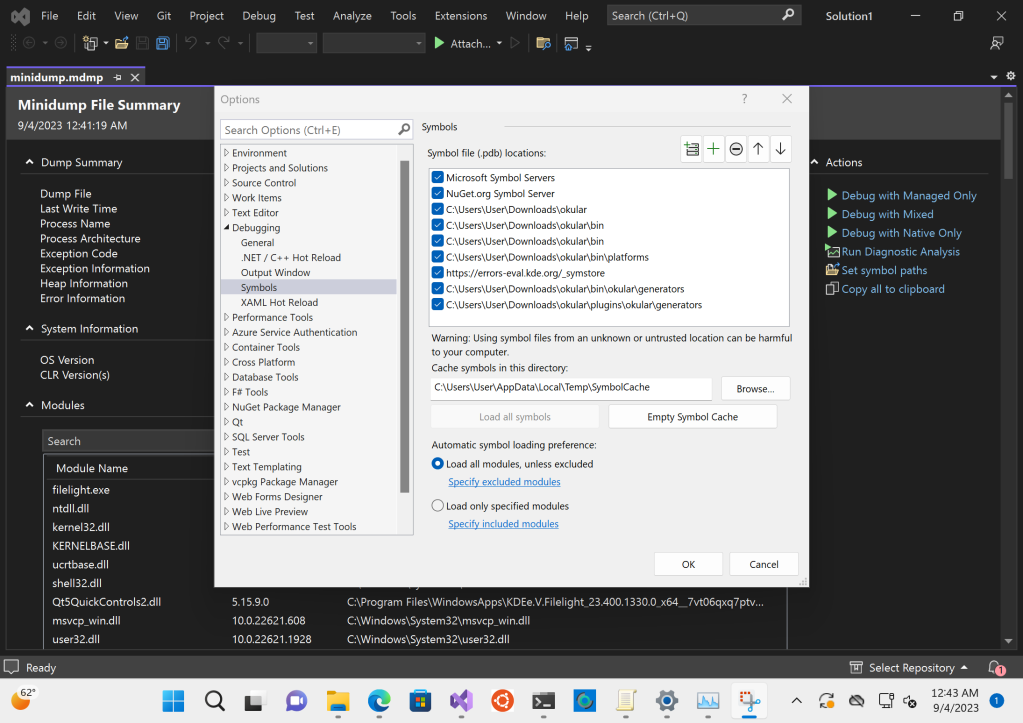
Once the symbol paths are set up you can hit Debug with Mixed and off the tracer goes. Slowly, because it needs to download a million symbols. But eventually you’ll arrive at your stack trace.
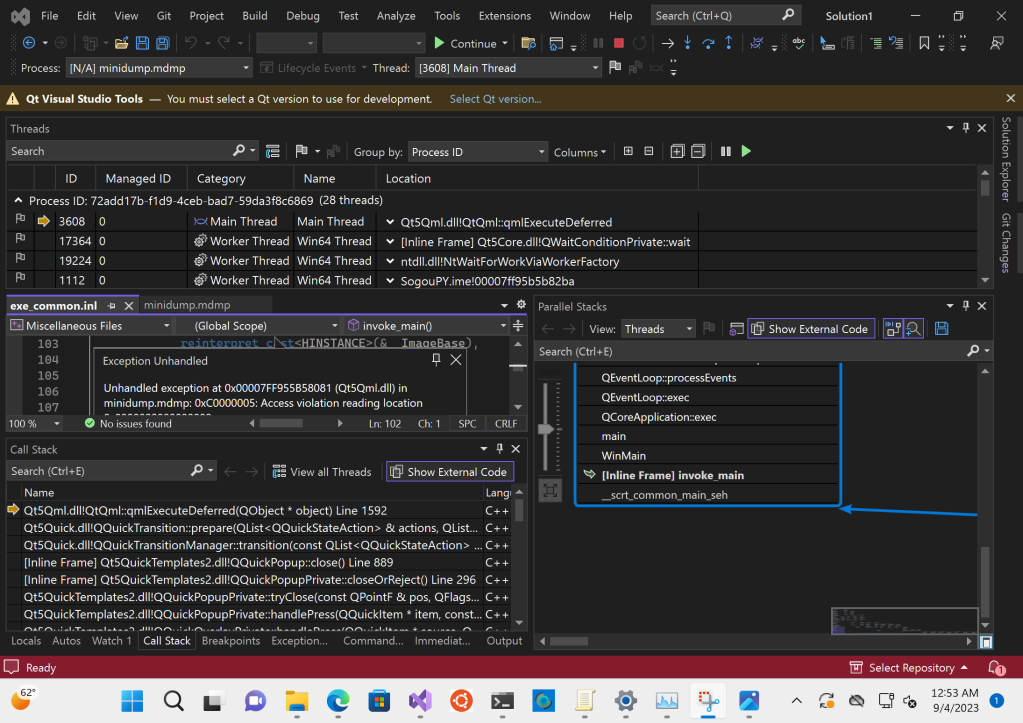
(nevermind my crazy setup, I was doing some wonky multi threaded debugging earlier and don’t know how to restore the UI 😅)
Hope this helps some!
Hugging Websites
…very hard.
KDE relies heavily on web services, and many of them need to be kept responsive even under strenuous load. I’ve recently had the opportunity to spend some time on load testing one of our websites and would like to share how that worked out.
To properly test things I wanted to have multiple computers make concurrent requests to the service and ensure that the service still performs within acceptable limits. To that end I needed a bunch of servers, software that can pressure the web service, and software that can make sure the service works.
The server bit is the easiest task there… any cloud provider will do.
The software also seemed easy. After very quick research Locust seemed as good a choice as any to poke at the service and make sure it responds. Except, after some pondering I came to realize that this is actually not so. You see, Locust does HTTP performance testing. That is: it makes HTTP requests and tracks their response time / error rate. That is amazing for testing an API service, but when dealing with a website we also care about the javascripty bits on top being responsive. Clearly a two-prong approach was necessary here. On the one hand Locust can put pressure on the backend and then something else can poke the frontend with a stick to see if it is dead. Enter our old friend: Selenium. An obvious choice given my recent work on a Selenium-based application testing framework. The advantage here is that Selenium can more or less accurately simulate a user using the website giving us a fairly good idea about perceived performance being up to spec. Better yet, both Locust and Selenium have master/client architectures whereby we can utilize the cloud to do the work while a master machine just sits there orchestrating the show.
The three building blocks I’ve arrived at are:
- A cloud to scale in
- Locust for performance testing (that the thing stays responsive)
- Selenium for interaction testing (that the thing actually “works”)
I actually thought about showing you some code here, but it’s exceptionally boring. You can go look at it at https://invent.kde.org/sitter/load.
At first I needed to write some simple tests for Locust and Selenium. They were fairly straight forward, a bit of login, a bit of logout. Just to start putting pressure on the server-under-test.
With simple tests out of the way it was time to glue everything together. For this I needed a couple more puzzle pieces. I’ve mentioned that both Locust and Selenium have “server” components that can manage a number of clients. For Locust that is distributed load generation, and for Selenium it’s called a Grid. For convenience I’ve opted to manage them using docker-compose.
The last piece of the puzzle was some provisioning logic for the cloud server to install and start Selenium as well as Locust Workers.
When all the pieces were in place amazing things started happening!
On my local machine I had a Selenium Grid and a Locust master running. Magically, cloud servers started connecting to them as workers and after a while I didn’t have the Selenium and Locust power of one machine, no, UNLIMITED POWER! (cheeky Star Wars reference).
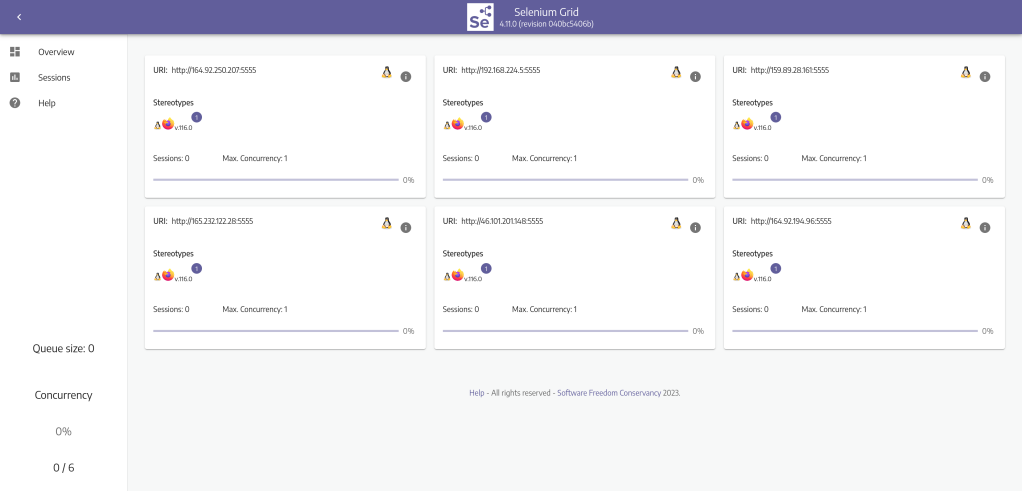
By starting a load test in Locust it was distributed across all available nodes, simulating more concurrent access than one machine would or could ordinarily do.
A simple loop also starts a number of concurrent Selenium tests that get distributed across the available grid nodes.
for i in {1..5}; python3 test.py& done
The end result is a Locust making hundreds of requests per second while Selenium is trying to use the UI. Well, for a while anyway… I naturally wanted to know the limits so I kept bumping the request numbers. At first all was cool.
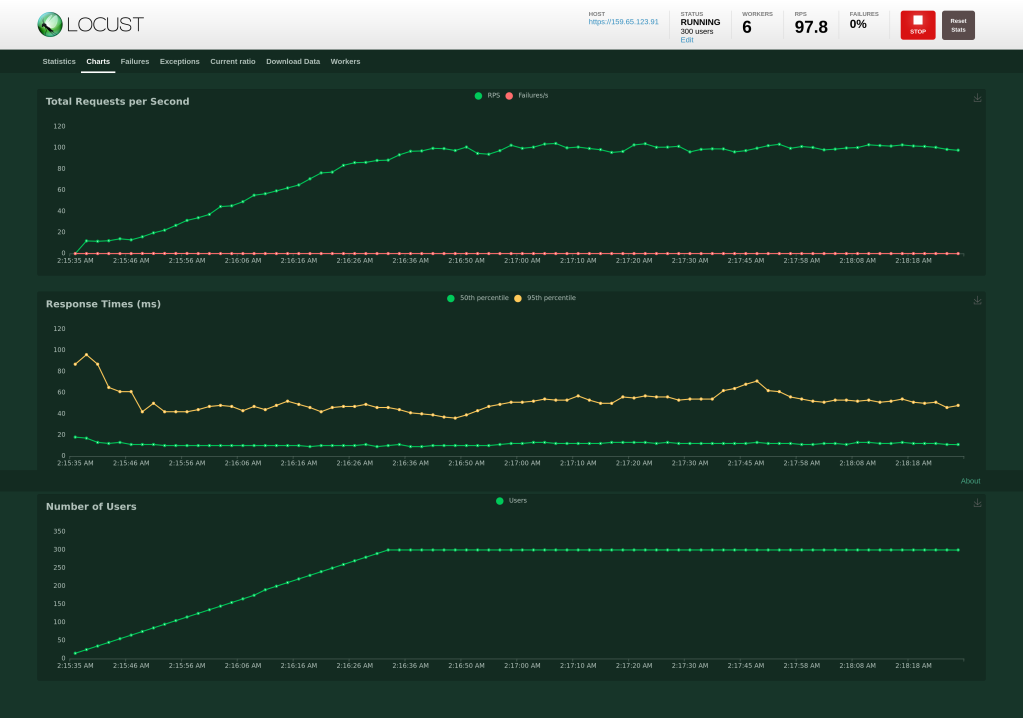
Response times in the sub 100ms at 300 users is pretty good I think. CPU usage was also at a comfortable level.
So I increased it to 600 users, which was still OKish. But when I started going towards 1200 users the problems started to appear.
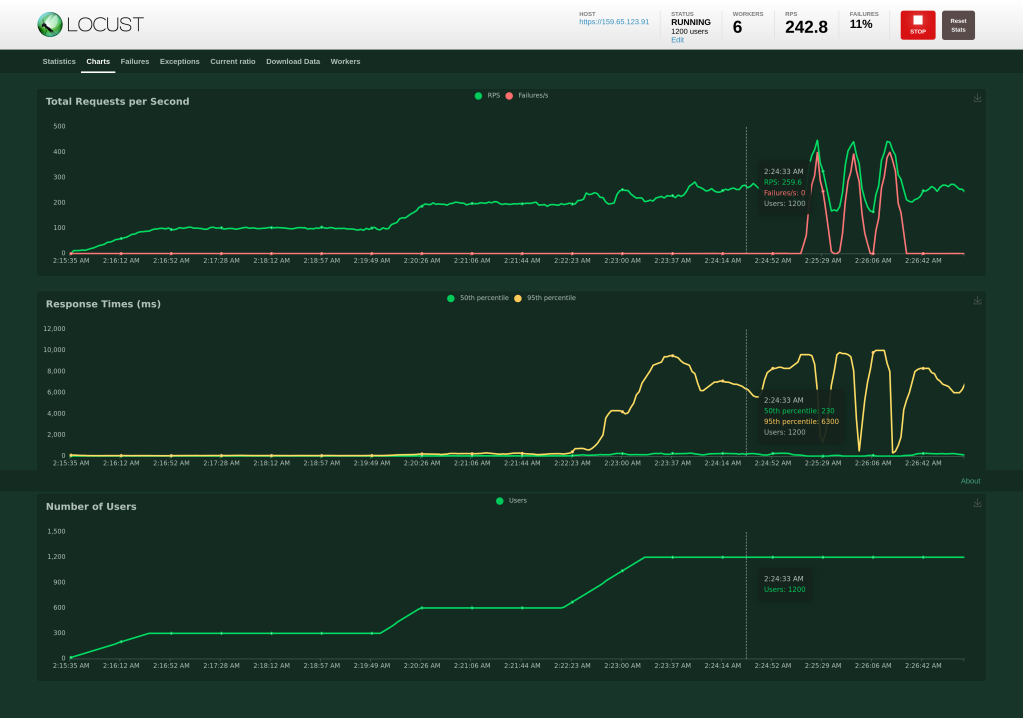
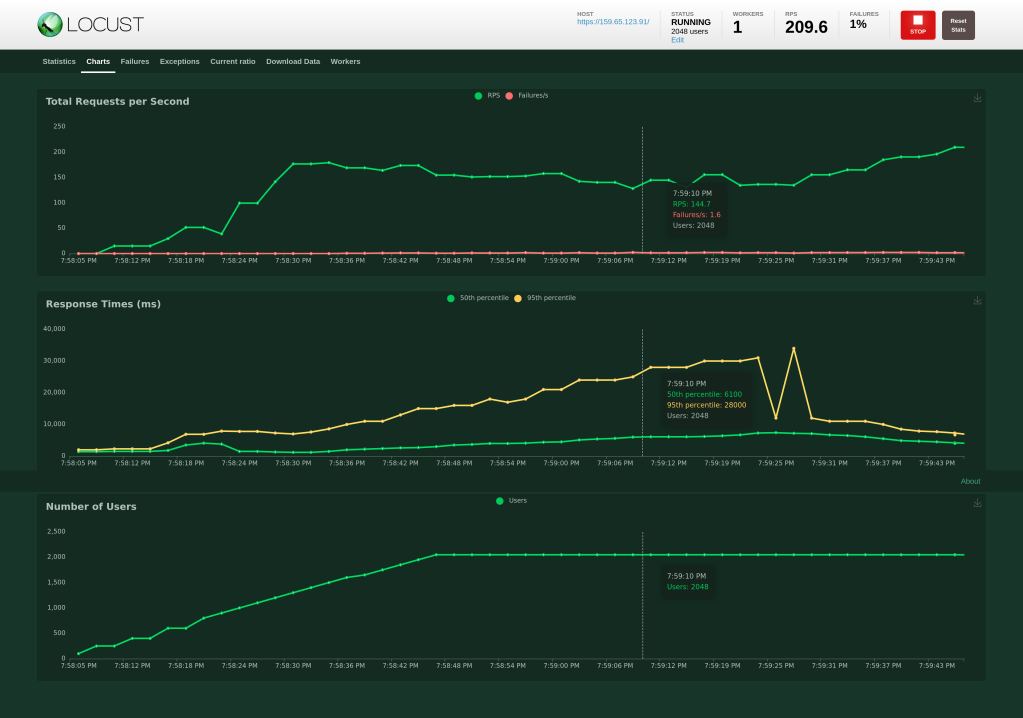
In the bottom graph you can see the two bumps from 300 to 600 and then to 1200. What you can see super clearly is how the response time keeps getting poorer and poorer the difference is so enormous that you almost can’t make out the response time changes from 300 to 600 anymore. Eventually the service started having intermittent interruptions when the Selenium tests were also trying to get their work done. Yet CPU and memory were not fully at capacity – In particular the intermittent failure hike is very suspicious. A look at the failures gave the hint: it was running into software limits. I bumped up the limits because the hardware still had leeway, and presto: no more failure spikes even when at 2048 users. Hooray! Response time does suffer though, so in the end there would need to be more reshuffling if that was an expected user count.
Conclusion
Knowing the limits of our services is very useful for a number of reasons, ranging from knowing how many users we can support, to how oversized our servers are for the task they are performing, to whether our service is susceptible to malicious use. Knowing the capabilities and weaknesses of our systems helps us ensure high availability.
To discuss this blog post check out KDE Discuss.